
There has been significant progress toward gender parity in many academic fields — and beyond it in some. The usual starting point for looking at this question in the US is the NSF’s "Survey of Earned Doctorates," which provides an annually-updated account of trends in PhD education. According to the most recent report from 2021, women make up almost 72% of psychology PhDs, 68% of health science PhDs, 53% in the biomedical sciences, and 50% in the social sciences. From there, percentages drop quickly: 33% in the physical sciences, 28% in math and statistics, 26% in engineering, and 25% in computer and information science. These percentages are not a measure of later employment in those fields — in fact the reality is probably somewhat worse due to "professional drop-off" among women in the STEM fields in which they are a minority. But it’s a place to start.
There is a parallel, widely held but harder to empirically document argument that the role of women in the curriculum lags their presence as faculty and instructors — and in some fields by a lot. Here, Open Syllabus can offer solid confirmation. The new Gender Statistics dashboard in "Open Syllabus Analytics" explores the question of author and instructor gender ratios across the full syllabus collection — some 16 million in early 2023. The most useful view at the moment is of the 62 fields into which Open Syllabus classifies syllabi. The results are striking.

Let’s pause for a moment on the methodology. Open Syllabus is building on a tradition of work that infers gender from first names, based on assigned gender ratios derived from censuses, baby registry databases, and similar sources.* This method is surprisingly good in most cases. Most common names are assigned to men or women almost exclusively. Some, of course, are assigned to various degrees across genders.
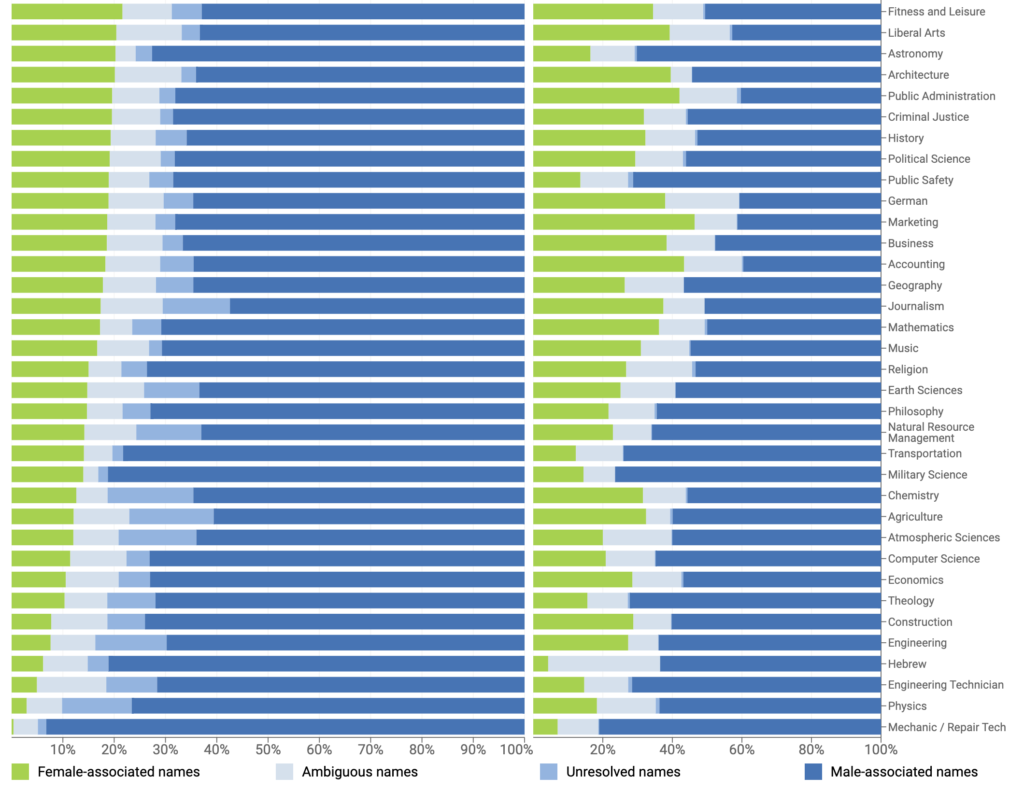
The Open Syllabus dataset is divided into four categories that capture some of this ambiguity. Names with a high degree of association with women (green) and names with a high degree of association with men (dark blue) are the main subject of this analysis. But we also break out ‘ambiguous names’ where the association with a specific gender falls below 70%. And ‘unresolved names’ that we can’t interpret. Citation practices that use initials are the most common source for this category.
And of course there are other caveats. This is a binary model that doesn’t account for non-binary gender identities. That’s a category problem that we can’t account for here. Name usage also varies by country and over time. Name analysis sometimes makes a mess of romanized Asian names. First name – last name ordering conventions vary and have, for some countries, changed in recent decades. There are, in other words, many limitations to the methodology. Yet with all that, the data tells a compelling story.
The best way to read the data, we think, is to compare the ratio of the ‘strong’ name categories — green and dark blue. The size of the ambiguous and unresolved names categories will then introduce more or less caution in interpreting results.
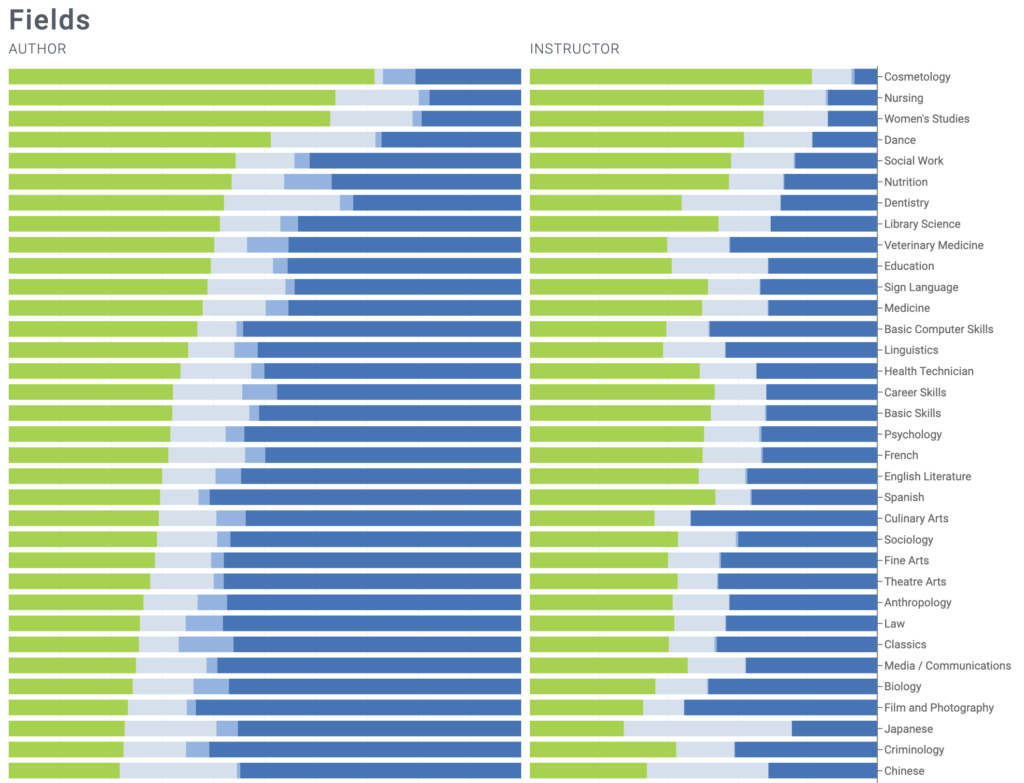
The main takeaway is that the ratio of women to men as authors in the curriculum lags the ratio of women to men as instructors in every dimension of the data we looked at. These differences track stereotypical notions of male and female dominated fields, with cosmetology, dance, and the ‘helping’ fields on on end and the hard STEM and engineering trade fields on the other.
The only fields in which women represent more than 50% of the assigned authors are cosmetology, nursing, women’s studies, dance, social work, nutrition, and dentistry — with only the first four significantly above parity. And even here, assignment ratios significantly lag instructor ratios. In cosmetology, women authors outnumber male authors by a bit over 3-1, but among instructors by 11-1. In dance, women outnumber men 2-1 among authors and 3-1 among instructors. And so it goes down the whole list. In social work, the ratio is just over 1-1 for authors and 2.5-1 for instructors. In psychology, 3-5 for authors and 3-2 for instructors. In sociology, 1-2 among authors and parity among instructors. In political science, 1-3.5 and 1-2.
As in the NSF data, things get rougher in the STEM fields — with the partial exception of biology. In biology, the ratio is around 2-5 for authors and 3.5-5 for instructors — middle of the pack in the dataset. For chemistry, 1-5 for authors and 3-5 for instructors. For computer science, 1-7 and 1-3. For engineering, 1-8 and 1-2.5. What’s the nadir among the major fields? Physics, with a 1-25 ratio of women to men among assigned authors and a 1-3.5 ratio among instructors.
What else is of note here? The poor performance of the business fields, for one, with 1-3 or 1-4 ratios among authors and near parity among instructors across the business, marketing, and accounting fields we classify. The dismal performance of the engineering trade fields for another. Construction, engineering technologies, and mechanic / repair technician feature at the bottom (mechanic / repair technician has statistically 0% women authors). And let’s take some note of economics — the worst of the social sciences, with a 1-7 author ratio and 1-2 for instructors.
How can we explain these lagging assignment to instructor ratios? The answer probably varies across fields. In the humanities and social sciences, the role of historical ‘canons’ almost certainly play a role. The history of social thought or literature by definition passes through centuries in which women were had few opportunities to contribute. In other fields, however, teaching is skewed toward textbooks, and accordingly to the more de facto gender politics of the textbook industry, which relies on author-brands built over decades. The top economics textbook authors are, with no exceptions, men in their 60s and 70s. Campbell’s highly-ranked Biology was first published in 1987. Elaine Marieb — one of the few women to break into this circle in the 1980s with Human Anatomy — would have been 87 this year. Brand investment strategies and the stickiness of the textbook marketing may be the main contributor to assignment lag in most fields
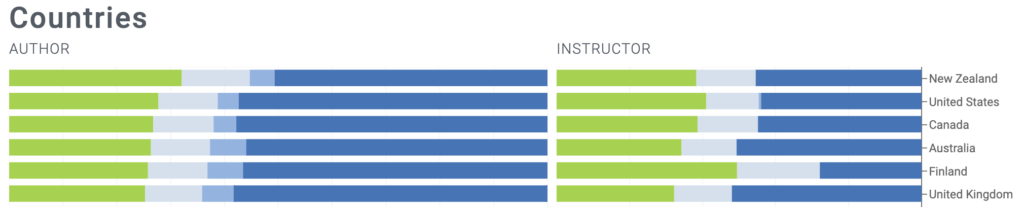
We are exploring other ways of viewing and navigating the data, and these will expand over time in the dashboard. It’s easy to aggregate at the country level, for example, and provide a sanity check on the overall composition of the collection. Across the anglophone countries, gender ratios are quite stable: among authors, 28% women in the US, 27% in Canada, 26% in Australia, and 25% in the UK. We’re less confident about results from non-anglophone countries where we make few accommodations for variations in name use.
It’s also possible to sort the data by school, and we will provide more detailed school breakdowns when we have good recent syllabus coverage. This, hopefully, will be an incentive for schools to join and contribute to Analytics, with the goal of building a global teaching archive that can support novel views of the collective dimensions of teaching.
*Among the papers that contributed to this work:
- Santamaría, Lucía and Helena Mihaljević. “Comparison and benchmark of name-to-gender inference services.” PeerJ Computer Science 4 (2018): n. pag.
- Bérubé, Nicolas et al. “Wiki-Gendersort: Automatic gender detection using first names in Wikipedia.” (2020).
- Menendez, David et al. “Damegender: Writing and Comparing Gender Detection Tools.” Seminar on Advanced Techniques and Tools for Software Evolution (2020).
The principal engineering and data science was done by Mingi Ryu.