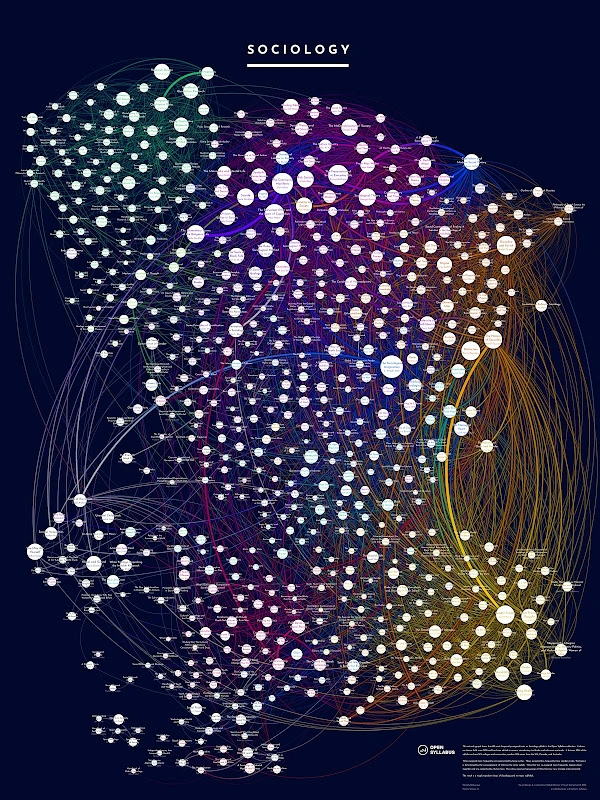
We’ve been featuring the new Open Syllabus posters, which are available at the OS Print Store. Mapping the top 600 or so titles in sociology produced an interesting spatialization of subfields: a tangle of theoretical perspectives in the north, shading into French theory in the east; sexuality in yellow in the southeast; criminology and deviance in red; and a number of race and class-focused subject areas to the west. You can zoom in and explore yourself in this semi-hi-res version. It’s also interesting to compare against the much larger Co-Assignment Galaxy, which maps all fields together.
These are very large (36″x48″) posters available for $54.99
Following up with another highish-res poster image, here’s Classics (available here as a very large 36″x48″ format print)

Very roughly, it divides into Greek literature in the south (in green) and art and religion in the north (in blue). Rome is in red and purple, with art and architecture on the right and family and gender relations on the left.
Last month we launched a print store with 11 ‘field posters’ designed by the great Nadieh Bremer. These are very large 36″x48″ high-res posters that map the top 600 or so titles in different fields. The size of a dot indicates how often a title is assigned. Titles cluster and are colored based on how often they are assigned together.
In addition to being gorgeous, our bet is that they are also instructive for students looking to develop an overall grasp of complex fields. Posters cost $54.99 and sales support the work of Open Syllabus.
We’ll feature these over the next month or two. Here’s Philosophy. You can click and zoom — though the resolution is a bit low.

One interesting thing about this layout, from my perspective, is that it doesn’t strongly reproduce my mental map of the field — which was formed through a political theory education that privileged a division between anglo/analytic and continental traditions. You can find those divisions, but the field overall includes a lot of ‘cross canonical’ works that are taught across multiple themes and traditions. It’s also interesting to compare to the place of philosophy in the larger ‘co-assignment galaxy,’ which maps a much wider array of titles across syllabi from all fields.
Each year, the Financial Times ranks international MBA programs. This year the top 10 are Harvard, Stanford, INSEAD (France/Singapore), U Penn – Wharton, London Business School, CEIBS (China), U Chicago – Booth, MIT – Sloan, Columbia, IESE (Spain), Yale, and Northwestern – Kellogg.
School ranking methods are often controversial: schools, educational goals, and concepts of quality vary considerably and the data and inputs into the models are often subjective. (Here’s Malcolm Gladwell on an older version of the US News & World Report ranking methodology). The FT mitigates these problems by focusing on a set of more narrowly comparable institutions (top tier MBA programs), on relatively unambiguous inputs (it heavily weights student outcomes measured in salary and program value in cost), and by limiting scoring to a top 10 (instead of elevating the minor differences that separate schools in the long tail). FT includes a “research rank” derived from the number of articles that faculty published in top journals, but salary factors outweigh research factors by 4-1. And it lightly weights a host of other variables — gender ratios, international diversity, faculty PhDs, and so on — that contribute to the quality of a business education.
Today we’re excited to release a big update to the Galaxy visualization, an interactive UMAP plot of graph embeddings of books and articles assigned in the Open Syllabus corpus! (This is using the new v2.5 release of the underlying dataset, which also comes out today.) The Galaxy is an attempt to give a 10,000-meter view of the “co-assignment” patterns in the OS data – basically, which books and articles are assigned together in the same courses. By training node embeddings on the citation graph formed from (syllabus, book/article) edges, we can get really high-quality representations of books and articles that capture the ways in which professional instructors use them in the classroom – the types of courses they’re assigned in, the other books they’re paired with, etc.
The new version is a pretty big upgrade from before, both in terms of the size of the slice of the underlying citation graph that we’re operating on, and the capabilities of the front-end plot viewer. The plot now contains the 1,138,841 most frequently-assigned books and articles in the dataset (up from 160k before) and shows 500,000 points on the screen at once (up from 30k before).


