
A few years ago we reported on the rates of growth in the adoption of ‘Open Educational Resource’ (OER) textbooks and ‘Open Access’ (OA) monographs. These are books published under Creative Commons licenses, which means that they can be used and circulated freely. In world of $200 commercial textbooks, OER textbooks, in particular, have become an important part of school and state efforts to reduce student costs.
But free has a few drawbacks. In markets for commercial textbooks (and most other goods), supply and demand are connected by the sale. Producers and consumers communicate through this information loop, and this relationship makes the market more or less efficient and — on the supply side — capable of adjusting.
The information loop for free digital books, on the other hand, isn’t closed. There is no sale or single point of access and titles are copied and circulate freely. It’s hard, accordingly, to know what the demand side of the OER and OA ecosystems looks like. And this lack of information becomes a problem for authors and publishers (the producers) and faculty and students (the consumers). Decisions to invest time and money by faculty, funders, libraries and others in creating new titles are made without strong insight into the demand for existing ones. Adoption decisions by faculty and staff are made without much visibility into the experience of other programs, which could provide models. Both sides of the equation involve risks, that those risks are hard to mitigate.
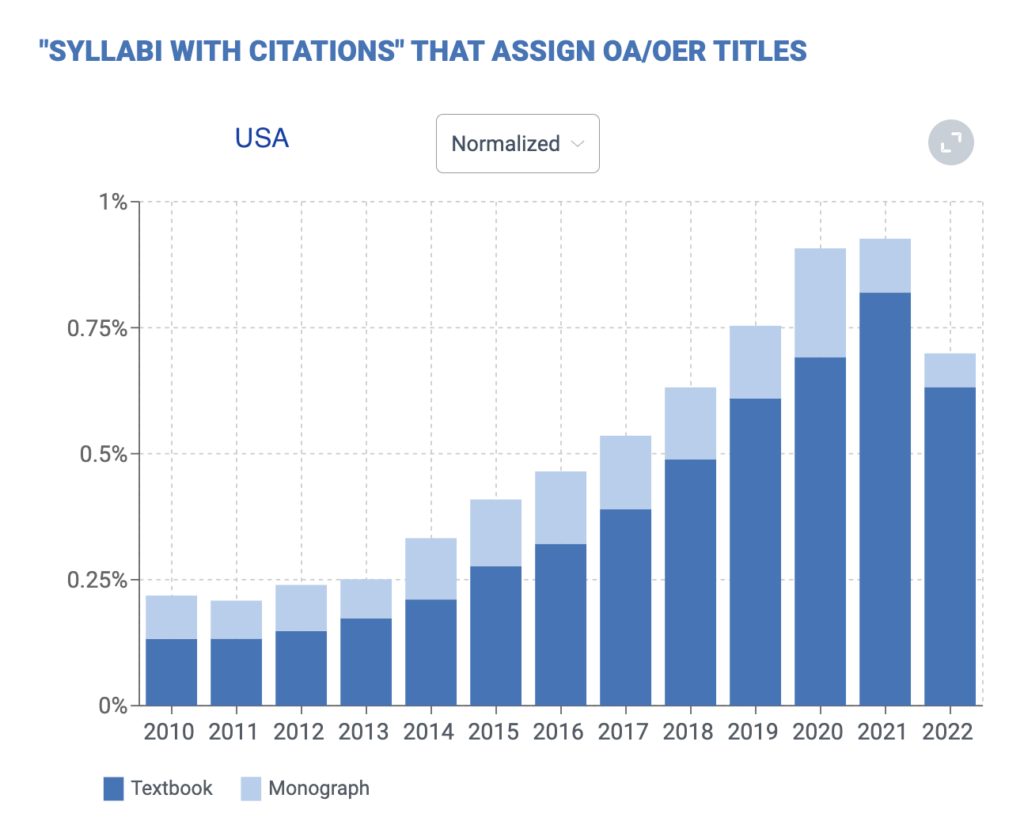
Open Syllabus can construct this demand side information from syllabi, and so partially close the information loop. The chart above continues the story we began to tell in 2021 — one of roughly 20% annual growth in OER adoption since the early days in 2013 and 2014. That’s fast growth, but from a very low baseline. In 2014, around .2% (1 in 500) syllabi used an OER textbook in the US. By 2021, that number was around .8% or 1 in 125. 2022 data shows a drop, but current year data can be uneven due to lag in our collecting practices. You can explore all of this in detail at the new Open Syllabus Analytics.
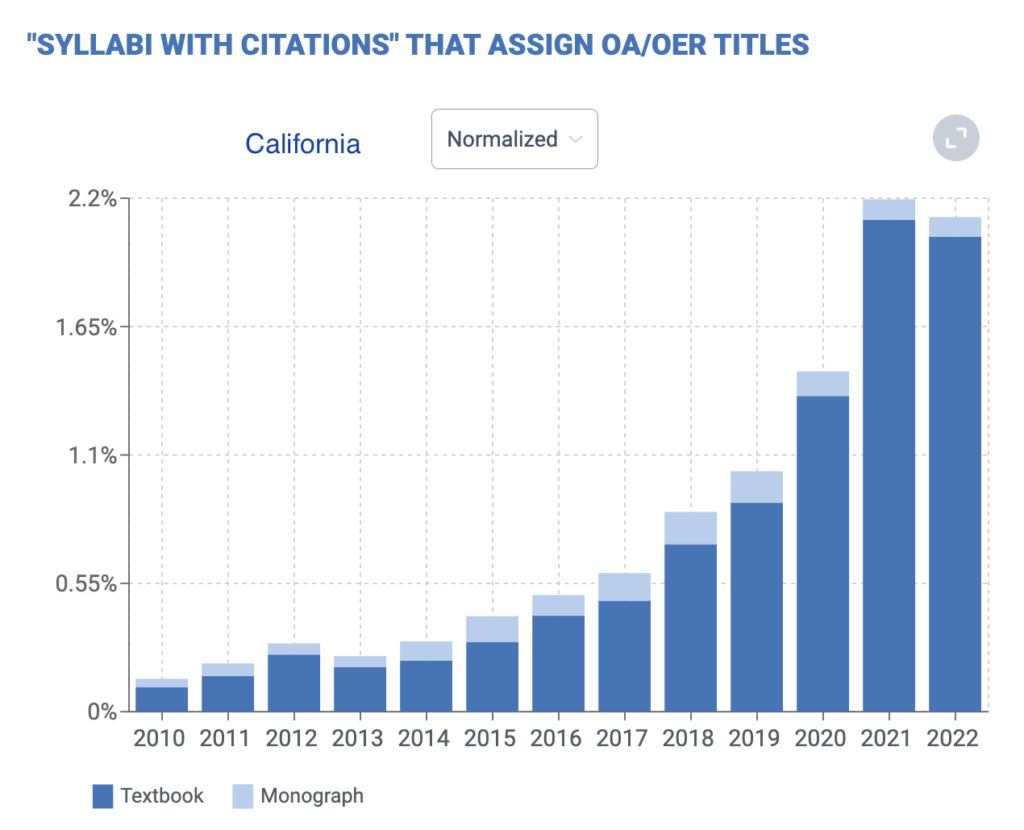
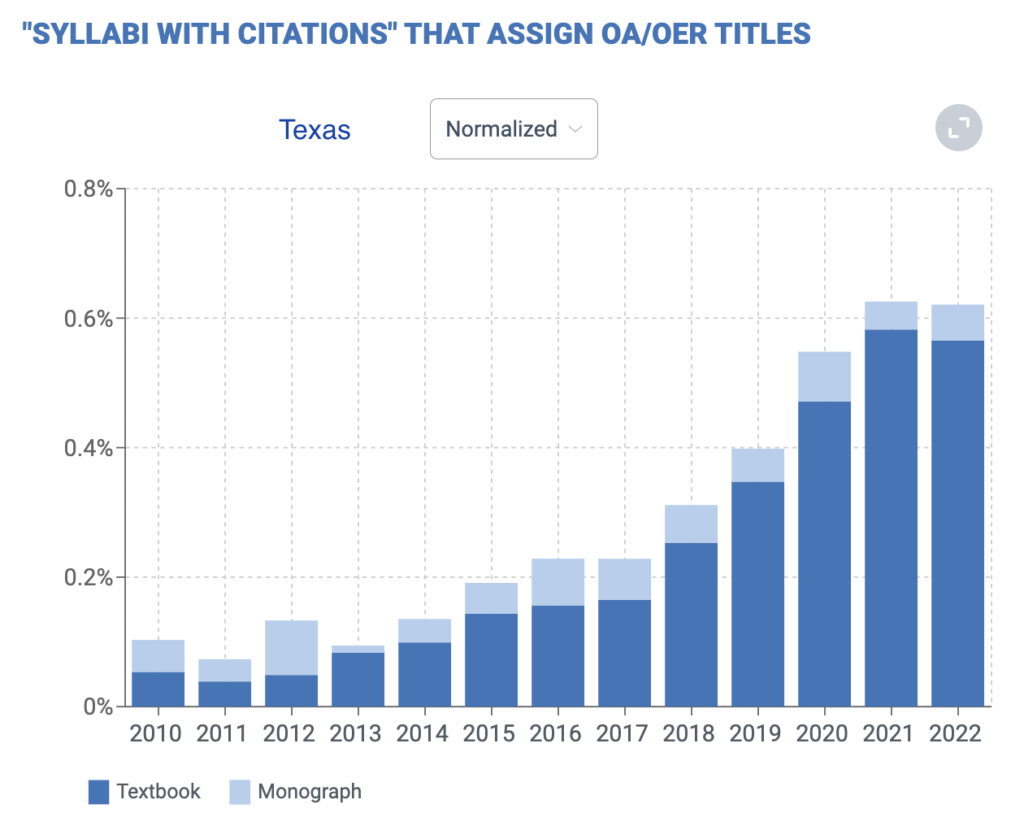
There is a lot of variety in adoption across countries, states, and fields. California is a national leader in OER adoption at nearly three times the national average. Texas lags the national average by about a third.
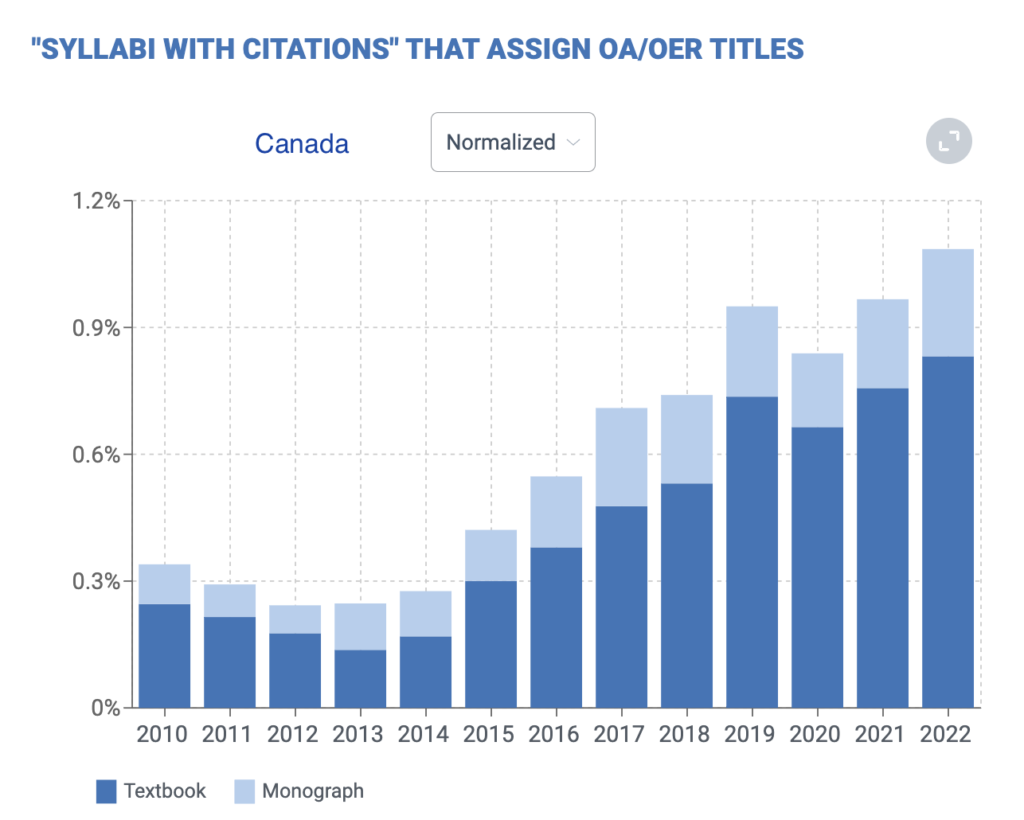
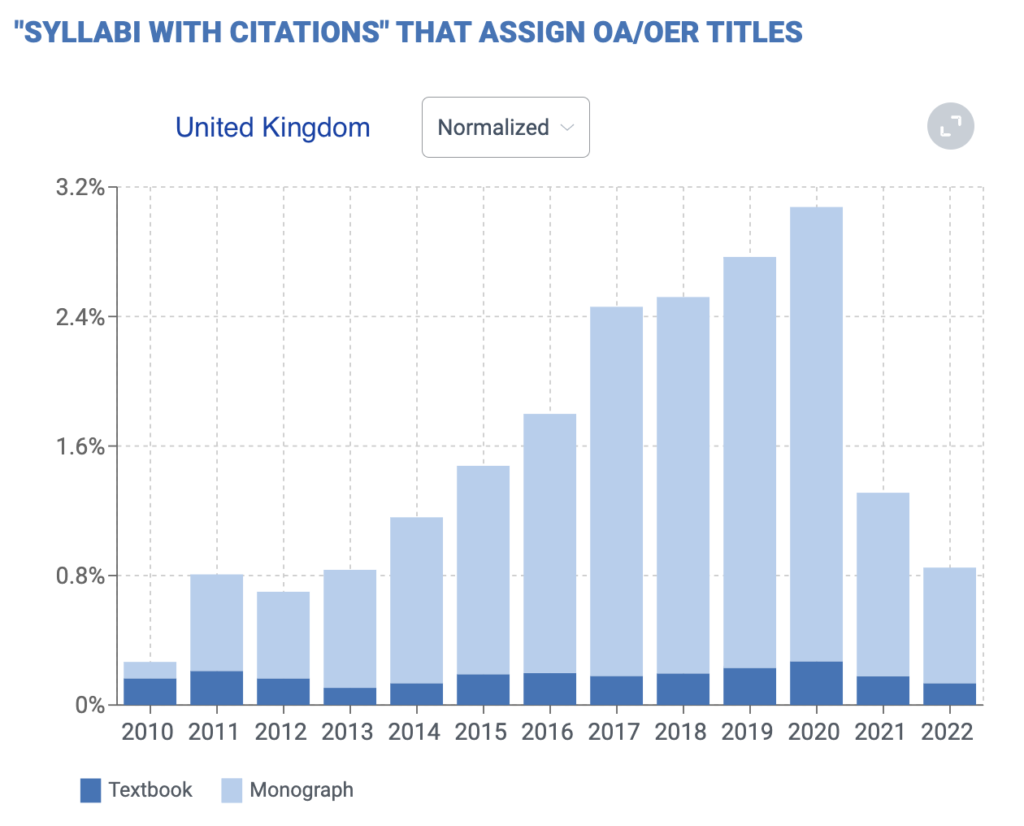
Canadian OER adoption looks very similar to the US but UK adoption is heavily skewed toward monographs, with very little traction for textbooks.
Math is the field with the strongest uptake whereas in other fields OER textbooks have only begun to be available.
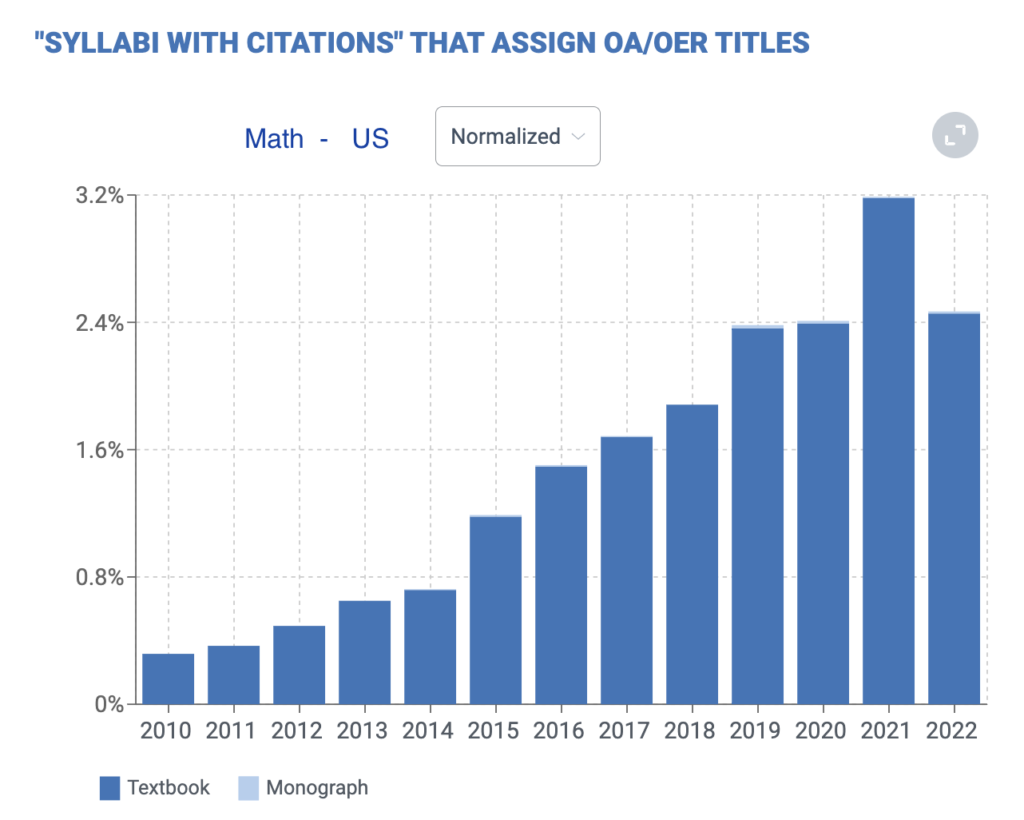
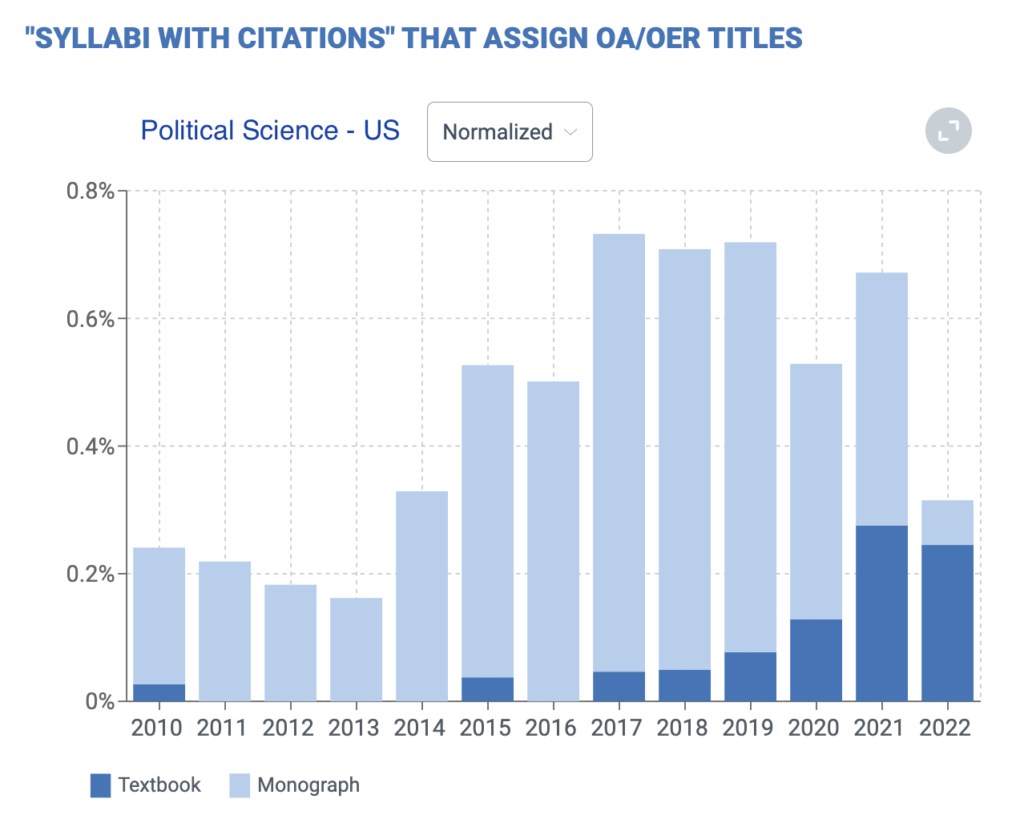
Because textbook use is sticky, it can take a long time for new titles to accumulate momentum. The major OER math titles are around a decade old. The computer science titles a bit older. Social science titles and business titles have begun to emerge in significant numbers only in the last five years. Major commercial textbooks, in contrast, are often decades-old brands that become synonymous with their teaching subjects.
The question for the next years is whether that growth rate will be sustained. If it is, OER will begin to take a significant chunk of the overall textbook market. Open Syllabus demand metrics will chart that progress. And if we’re right, by charting it, accelerate it.