We launched a major update to Open Syllabus a few weeks ago that includes a new version of the dataset, new features, and some changes to how you can explore Open Syllabus data.
Data
First, the dataset (v 2.11). Our goal with every update is to increase both the size and quality of the dataset. With the new version, we’ve added about a million new syllabi from the US, 300,000 from the UK and Australia, and 150,000 from Canada. The total number jumps from 18.7 million to 20.9 million. The collection also has a bit more historical depth due to better digging through school archive sites — enough so that we’re comfortable pushing back the starting year for charts to 2008 (from 2009). We want to keep extending the historical window back, but this depends increasingly on faculty and school archival contributions.
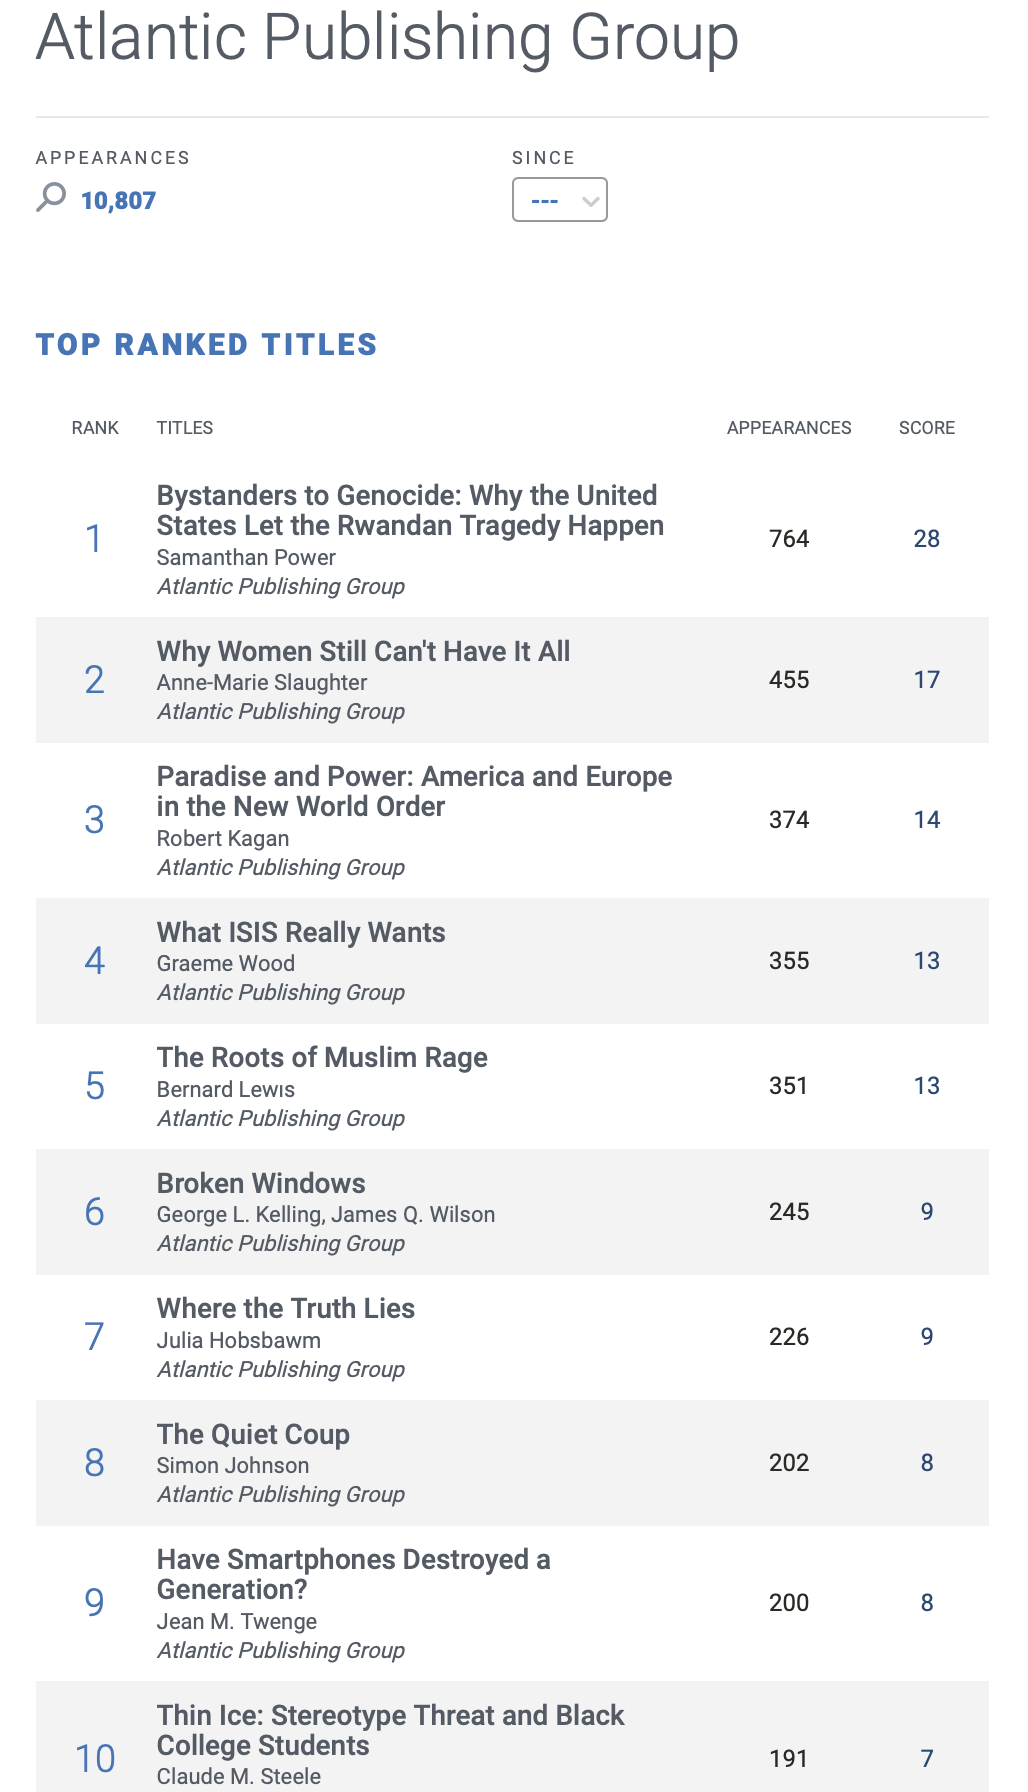
Next, data quality. We have significantly expanded both the range of titles we can discover and the quality of our parsing of citations within syllabi. First, the number of unique discovered titles in the collection has jumped from 3.4 million to 3.8 million. This gain comes primarily from building a source catalog from ISBNs found within the collection, which has significantly expanded our view of non-US publishing in particular. We also updated the citation catalog that we build from linked content in the dataset, which means that we have a better view of periodicals, websites, videos, and other non-traditional sources. Here are the top-assigned titles, for example, from The Atlantic Monthly.

Combined with improvements in how we deal with the variety of citation practices used in syllabi, the number of citations discovered in the collection (across 21 million syllabi) has jumped from 56 million to 65 million. In short, we’re providing a more complete view of the same collection at the same time as we add to it.
Accounts
The biggest change affects how you can explore the data. We have shut down the old ‘free’ service, the Syllabus Explorer, in favor of creating an open tier for the new, better service, Open Syllabus Analytics. Analytics now has open, trial, and subscription access. The open tier is much better than the Syllabus Explorer, not least in the number of syllabi it includes, which jumps from 7.2 million to 11.9 million. It retains a 2019 date cap (up from 2018) and, compared to the trial and subscription versions, more limited functionality. You can sign up for a trial for free to explore these differences. Our goal is to get schools to subscribe.
Accounts have also changed. Now your account is just based on your email -- and if you sign up with a school email, it's immediately approved. Logging in with an email keeps you logged in on that decice and browser.

The Gender Dashboard
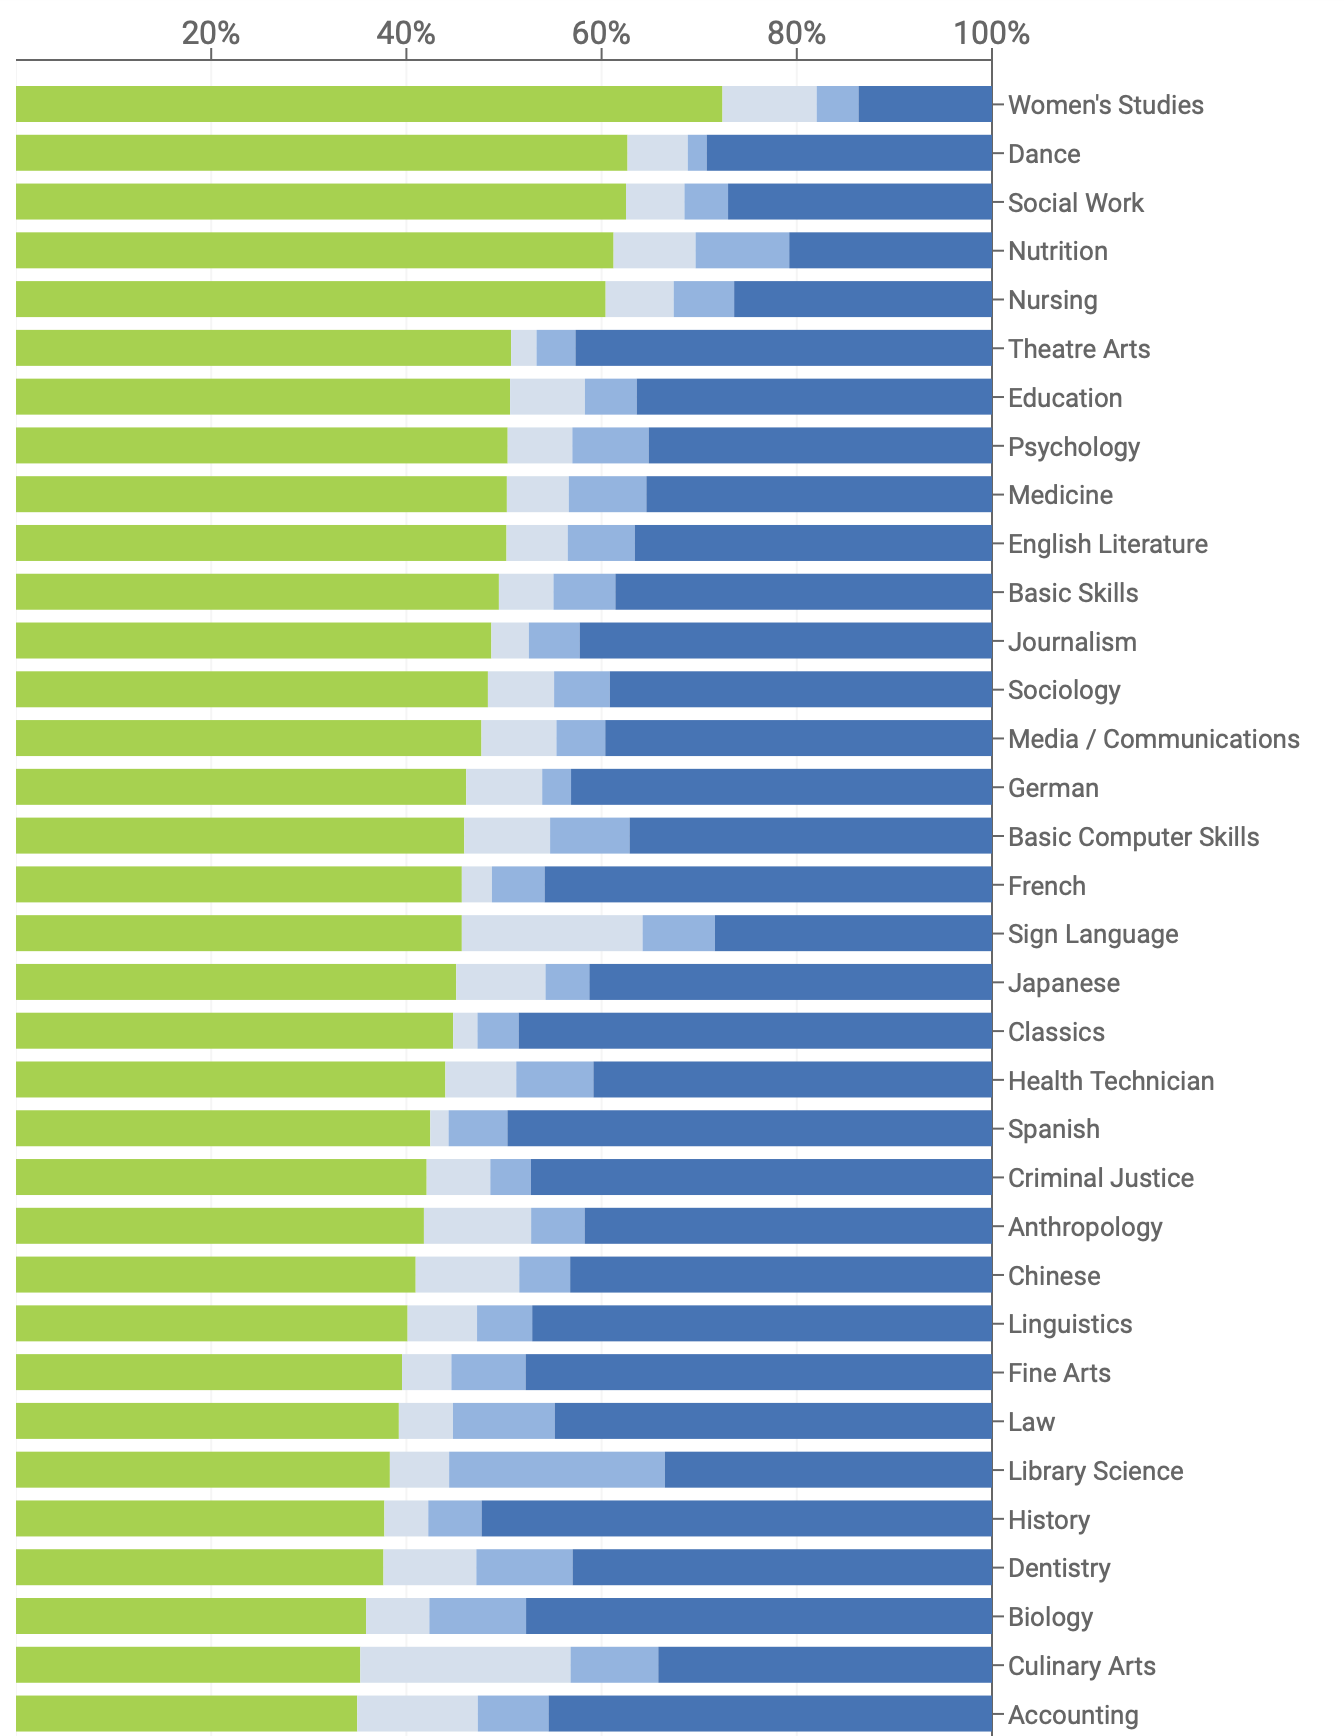
We’ve also improved the Gender Data dashboard, which is available to logged in users. Now you can search and filter across a wide range of dimensions, including country, field, and school. Want to know, for example, what gender ratios look like across academic fields in Australia or how those ratios have changed in law in the US? Now you can.

That’s it for 2.11! Check it out — and if you like it, talk to your data services librarian about subscribing.