Open Access (OA) monographs and Open Educational Resource (OER) textbooks are works that are ‘openly licensed’ — that is, they can be used and distributed for free. In a world of $200 textbooks, OA/OER plays a fairly high-profile role in efforts to reduce the cost of education.
But free circulation makes it difficult to track classroom adoption, which in turn makes it difficulty to understand the shape of demand for OA/OER work–either overall or with respect to particular subjects. The link between supply and demand established in the commercial book market by a sale doesn’t exist in the OA/OER world. Our thought is that this delinking is one reason–and maybe a significant reason–for the relatively low rate of adoption of OA/OER in teaching, despite over a decade of efforts. It’s still too hard to characterize demand for these titles to faculty, curricular designers, publishers, and investors. It’s hard to tell what’s popular and what’s been effectively adopted in peer institutions.
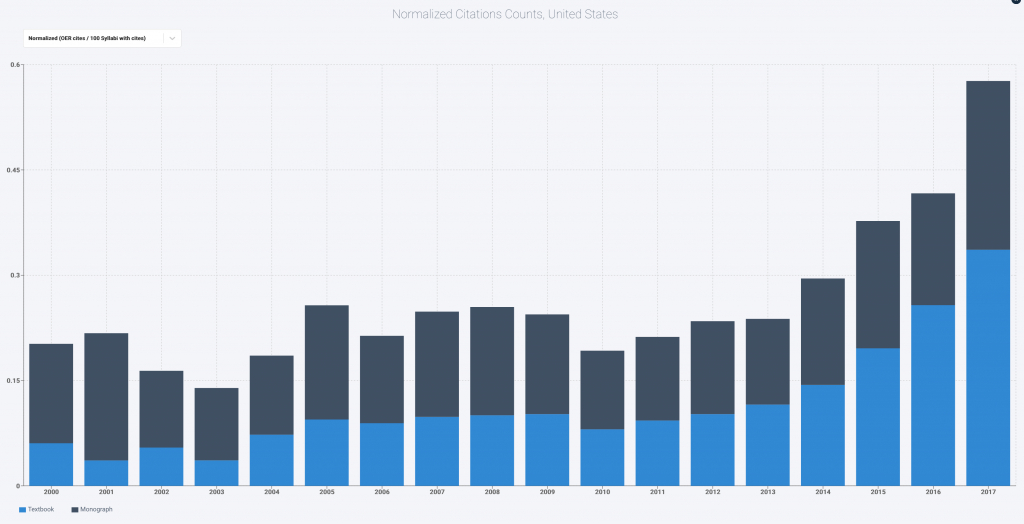
So we’re eager to see what happens when we partially close this information loop by measuring demand via syllabi. Here’s a normalized US trendline for OA/OER adoption based on the OS collection (drawing on catalog information from the Open Textbook Library and the Directory of Open Access Books). It shows rapid OER textbook growth in recent years–but from a very low baseline. In 2017, roughly 1 in 300 classes used OER textbooks and around 1 in 400 assigned an OA monograph (the lighter blue is for textbooks; darker for monographs).

That’s across all ‘US syllabi with citations,’ which requires caveats since some types of classes don’t have assigned materials.
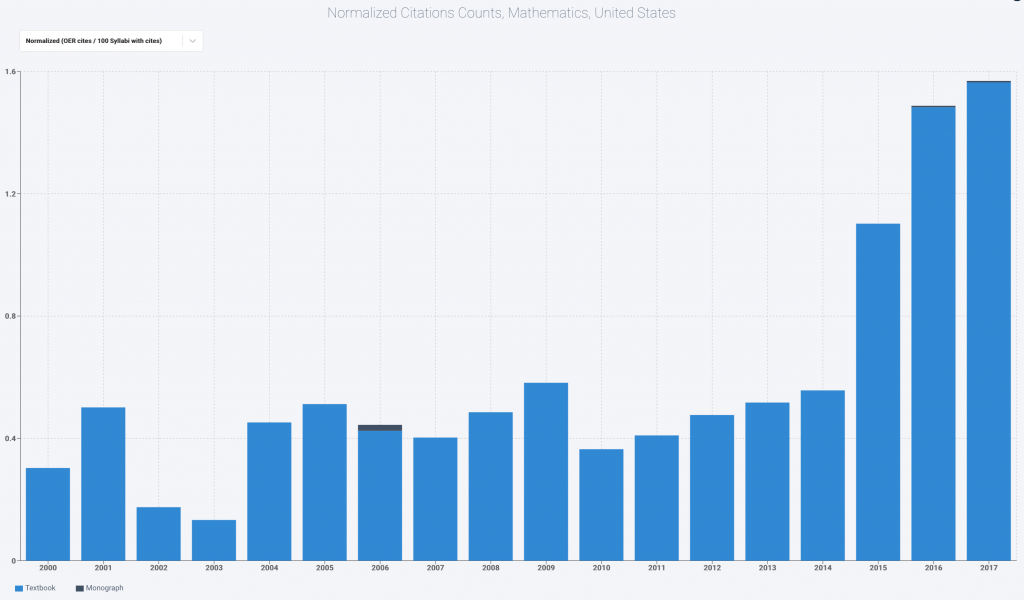
The availability of good OER materials also varies significantly by field and topic. Studies that have focused narrowly on classes for which there are good OER equivalents find significantly higher rates of adoption–around 6% in this 2018 study. Recent surveys of OER use also suggest higher and rising numbers. We can’t zero in on specific classes but we can explore differences between fields. In Math–a field with a number of widely used OER textbooks–we put US adoption at 1.5% of ‘syllabi with citations’ in 2017 (and climbing).

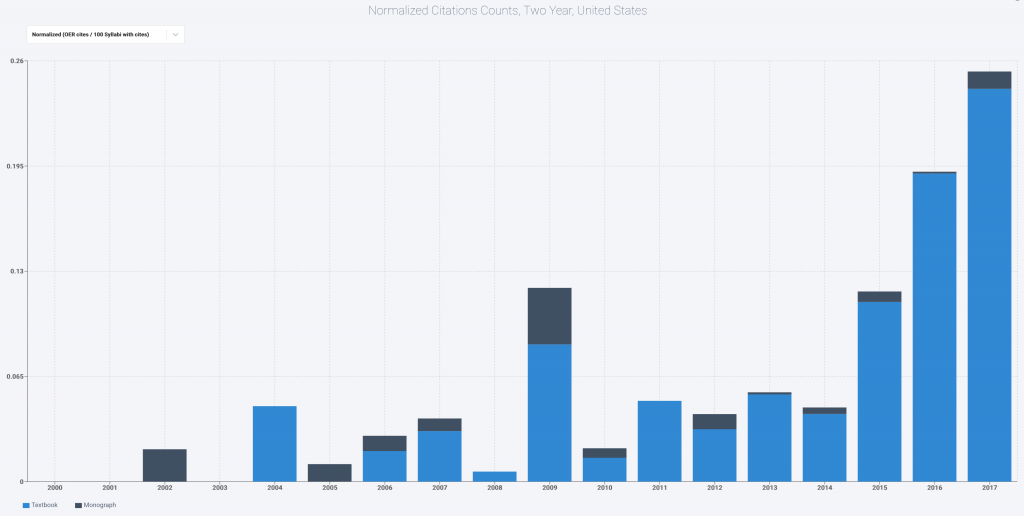
There are other ways to slice this data. The chart below focuses on US 2-year colleges. The data is choppier (we may drop the early 2000s from charts, which are noisy when normalized) but pretty clearly show sharp recent growth in textbook adoption–and virtually no role for OA monographs, which are typically more advanced scholarly work.

There is a decent case, in other words, that OER is at a takeoff point in higher ed–though still at very low levels of adoption across the curriculum. These charts come from a dashboard that we’ll publish in a couple weeks. Then you can explore.