The Co-Assignment Galaxy represents titles based on the extent to which they appear together on syllabi. Each title is a dot whose size is determined by the title’s total assignment count in the collection. This simple principle structures a very detailed map of fields, subfields, and their boundaries. It also combines what we could call content-based and institutional ways of thinking about fields. By content based, I mean that the layout is derived solely from similarities in the assigned contents of millions of classes, with no a priori knowledge about how those classes divide into sociology or history or physics (we added the labels later). At the same time, we developed tools that do sort syllabi into the classificatory schemas used by universities, which reflect a more administrative and institutional view of fields. This institutional account shows up in the graph through the use of color. A title receives a color based on its predominant field of assignment. Field boundaries and border zones are represented in the Galaxy by this interaction between spatial layout and color.
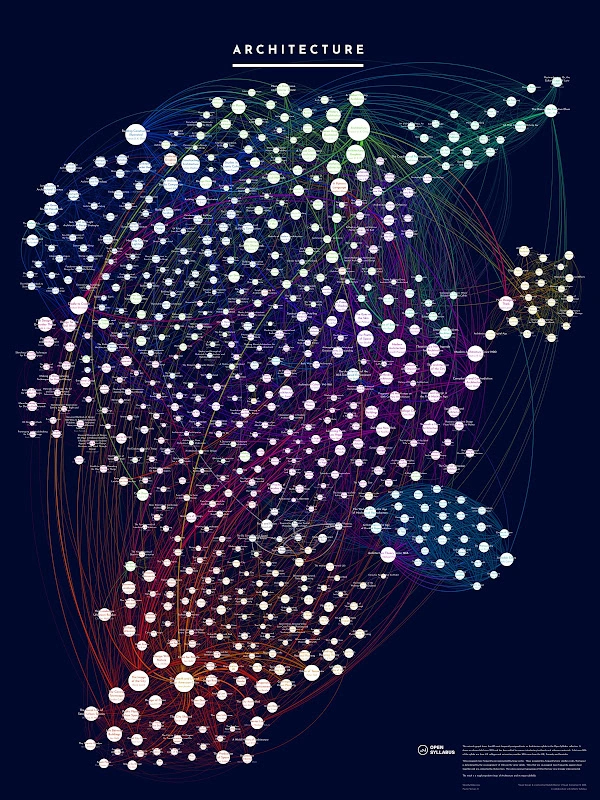
Another hi-res, giant field poster you can buy at the OS Print Store. Bring joy to the actual, aspiring, or just nostalgic architect/urbanist in your life for the holidays. Click to explore.
We’ve wanted to tease out movie rankings for a while. Movies are maybe the most passionately invested category of Open Syllabus citation data, surrounded by scholarly and popular debates and a teaching field that cuts across many fields. That makes them a rich target for a Lab.
The OS Movie Lab (like the earlier Link Lab for journalism) is a navigable ranking of movies taught in college classes–in this case the 1201 movies assigned at least 20 times in the OS corpus since 2015. It sits outside the core OS toolset because we don’t have a reliable ‘Movie ID’ in our citation catalogs that would make them a searchable subcategory. Instead, these rankings are built from a hand-curated list derived from the larger OS dataset.
The rankings provide a snapshot of the thinking of hundreds of thousands of faculty about what movies to teach, drawn from millions of syllabi. Many of these decisions clearly belong to a Film Studies-centered discussion about how to teach the history of cinema. But the data comes from all fields and includes choices that reflect a wide array of teaching rationales.
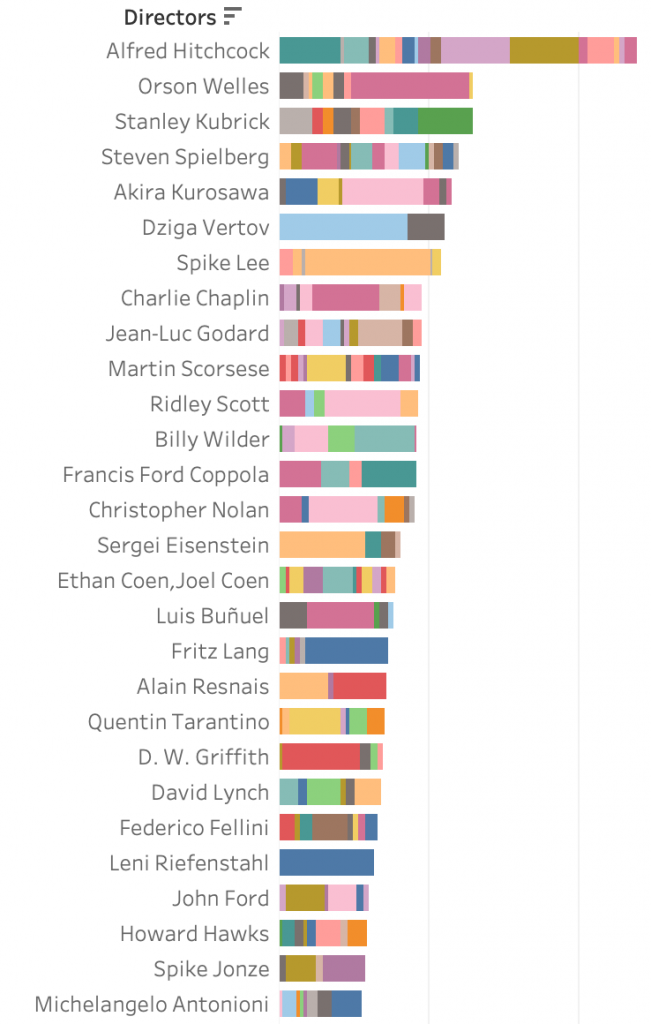
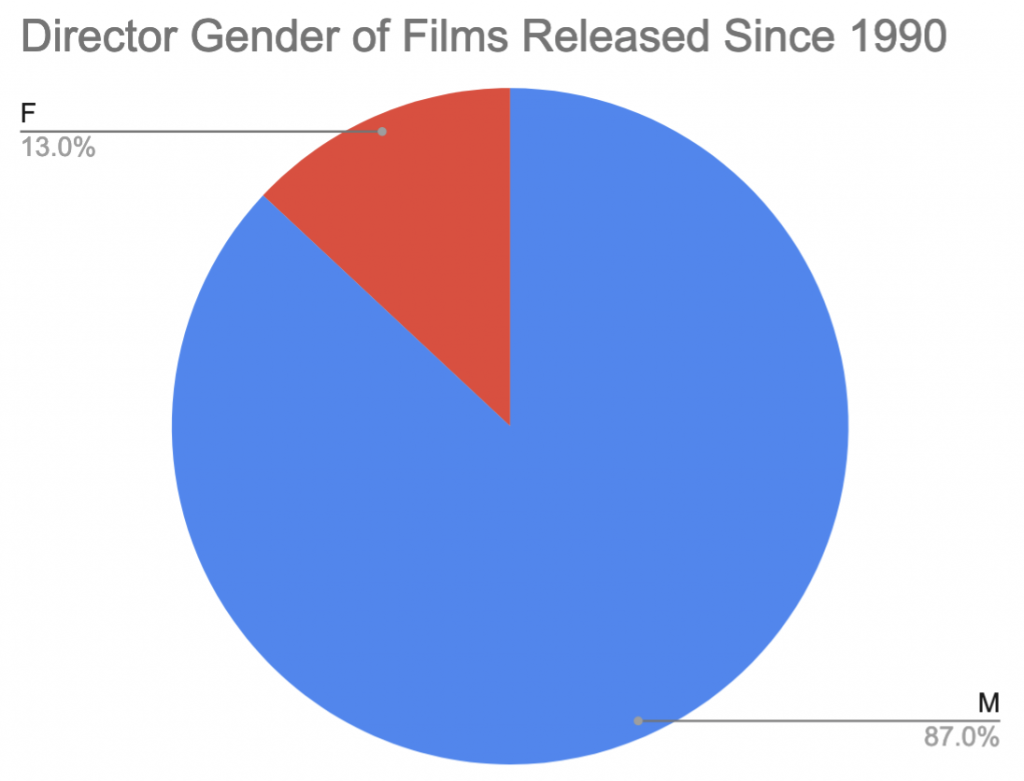
Overall, the rankings present a very classical view of film canons and film studies — still oriented around the post-war American auteurs and the various European waves. Some of this reflects the national biases of the OS collection: around 55% of syllabi are from the US, 15% from the UK and another 10% split between Canada and Australia. The rankings also demonstrate the slowly-changing gender politics of the canon — and, at a step removed, of access to directorial roles. Women directed 3.5% of the assigned films released prior to 1990. For films released since 1990, that number is 13%.
The variety of teaching rationales visible in the rankings is also worth highlighting. Leni Riefenstahl is the highest-ranking woman director at #24, but is most frequently assigned in history classes, not film. Documentaries and historical dramas play roles in topical classes, and literary adaptations do well in literary studies. You can explore the teaching roles of these titles more fully in the Syllabus Explorer. The Co-Assignment Galaxy meanwhile, provides a very different perspective on the organization of film studies and film canons. Lastly, if you’d like to own a giant, beautiful poster of some of this data, we’ve got you covered.
Time for caveats about the data. OS’s collection is uneven across schools and over-represents Texas within the US; the 2.6 dataset (on which these rankings are built) is bigger and better than the 2.5 dataset but smaller and worse than the upcoming 2.7 version; the underlying citation catalogs (such as the Library of Congress catalog) are messy and often inconsistent; faculty citation practices for film in syllabi are poor; translated titles and director names often have variations; human labeling is error prone; machine learning is imprecise; and on and on. We spend a lot of time on these issues and have gotten better at handling many of them. But they still shape results in a variety of known and unknown ways. Lastly, determining a film’s country of origin becomes complex in the 1990s with the rise of international co-productions–especially in Europe. We have used the first listed country on IMDB in such cases.
The map, in other words, is not the territory. But it’s hopefully a useful guide to it.
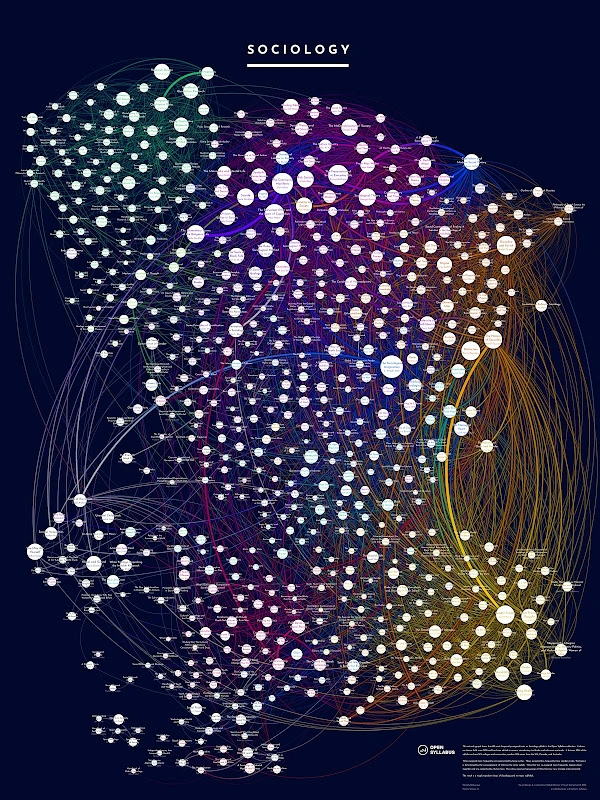
We’ve been featuring the new Open Syllabus posters, which are available at the OS Print Store. Mapping the top 600 or so titles in sociology produced an interesting spatialization of subfields: a tangle of theoretical perspectives in the north, shading into French theory in the east; sexuality in yellow in the southeast; criminology and deviance in red; and a number of race and class-focused subject areas to the west. You can zoom in and explore yourself in this semi-hi-res version. It’s also interesting to compare against the much larger Co-Assignment Galaxy, which maps all fields together.
These are very large (36″x48″) posters available for $54.99